NDVI time series vs single-date imagery for crop identification
7 October 2026
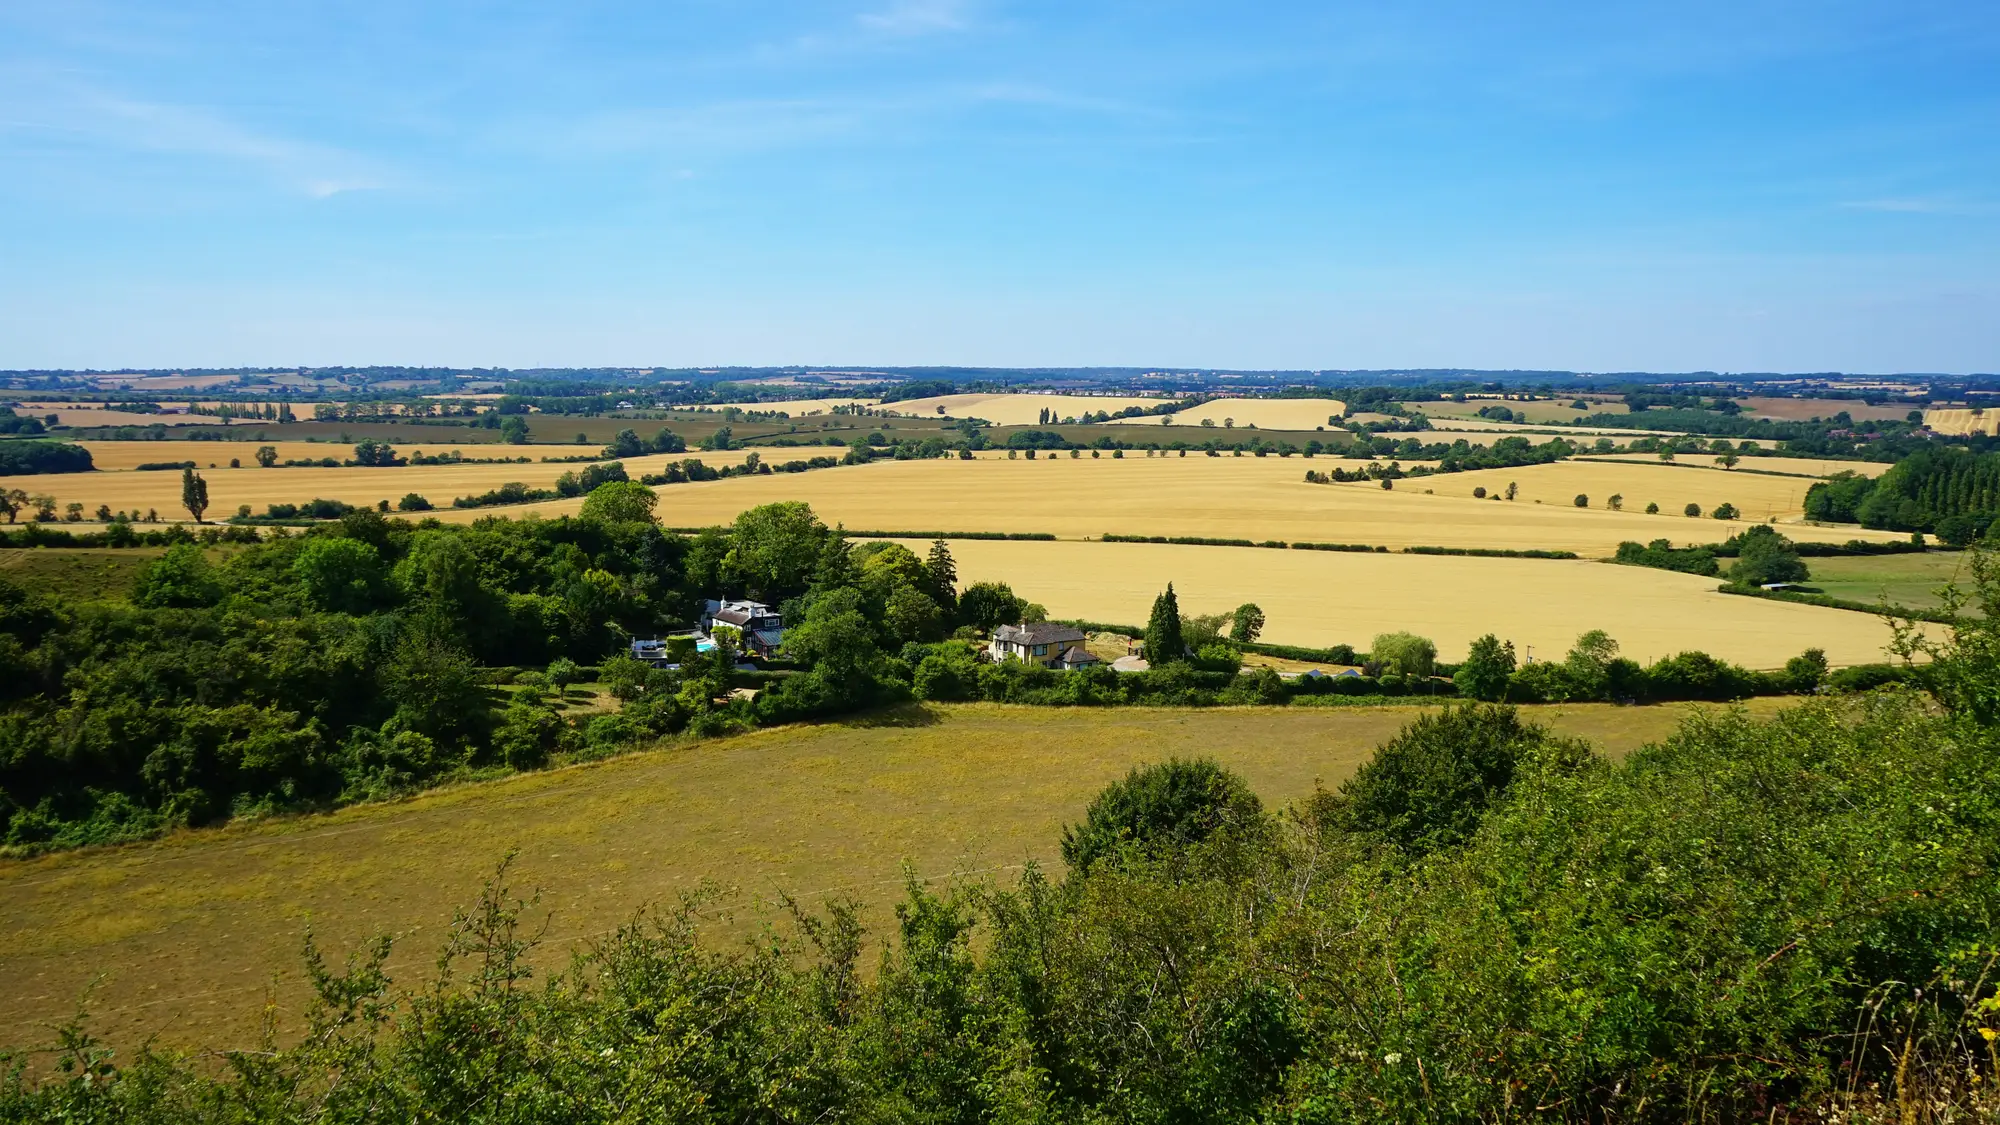
A parcel declared as winter wheat and a parcel declared as winter barley can sit next to each other and look almost identical from a single satellite pass in April. Both are green, both are tillering, both reflect light in roughly the same band ratios. If your crop-type check is built on one image, that's the moment it fails: the classifier calls the barley parcel wheat, or the other way round, and nothing in the output flags that it guessed.
This is the core argument for using an NDVI time series instead of a single date: crops don't differ most in how green they are on any one day. They differ in when they green up, peak, and senesce. That timing is the signature.
Why a single pass misses crop types that look alike
Think about the pairs that cause the most trouble on a declared-crop file: wheat vs barley, sunflower vs maize in early stages, rapeseed vs some legumes before flowering. On any single date chosen for cloud-free coverage, several of these can sit in the same reflectance range. A classifier working off one pass has to guess within that overlap, and it guesses wrong often enough to matter when the output feeds a compliance decision.
Single-date imagery also inherits whatever conditions existed that day. A pass taken right after a rain event, or during a short dry stress window, shifts the signal for every parcel captured in it. There's no second data point to check it against. The whole crop-type call for that acquisition rides on one moment in the field's year.
Phenology-based classification: reading the whole curve, not one point
A phenology-based approach pulls reflectance values across the growing season and looks at the shape of the curve each parcel produces: when it starts rising, where it peaks, how fast it drops off at harvest or senescence. Winter cereals green up and peak earlier than spring-sown row crops. Oilseed rape has a flowering spike that shows up distinctly in the mid-season passes. Maize holds vigor later into summer than most small grains. None of that is visible in a single frame. All of it is visible once you have enough passes spaced across the season to trace the curve.
This is the practical difference between multi-temporal and single-date crop mapping: a single date gives you a snapshot that has to be interpreted in isolation. A multi-temporal series gives you a trajectory, and trajectories separate crop types that snapshots can't.
What this changes for the annual check
For a compliance officer running the annual declared-crop check, the implication is straightforward. A crop-type call built from one acquisition date is a call built on whatever that parcel happened to look like that week. A crop-type call built from a season's worth of passes is built on how the parcel actually behaved, which is closer to what a sample-plot walk would have confirmed on the ground, without walking every plot.
Crop Type Mapping works from that second approach: every declared parcel gets one crop-type call, dated and sourced, built from its seasonal reflectance signature across wide-swath multispectral passes, delivered as a layer you can sit next to the claim file. It's refreshed once per season, which matches how the check runs, not continuously, because a crop-type call doesn't need to update daily to be useful at claim time.
If your current workflow leans on a single image per parcel per year, it's worth asking how many of the wheat/barley or rapeseed/legume pairs in your file are sitting in the overlap zone that one date can't resolve. Get in touch to see what a seasonal crop-type layer looks like against this year's declared parcels.